1.CliPME Database Overview
CliPME is the first database dedicated to store/analyze mutation profiles and regulatory networks from sequencing data of multiple pathogenic bacteria. Hosted on a high-performance Linux cloud server, it integrates genomic and transcriptomic data from pathogenic bacterial species, encompassing large sequencing samples across different published datasets. The database is organized into three core modules (MutFinder, MutAnalyzer, and ExpMiner), providing a powerful platform for mutation analysis, functional prediction, and gene regulatory network exploration. We also developed R package qMut to provide advanced R users with a high-efficiency data analysis interface. In the future, we will continue to expand the database's species coverage to establish a more comprehensive platform for clinical pathogenic bacteria analysis.
2.Citation
If you used the data of modification, please cite:
Phosphorylation
M.tuberculosis:
Frando, A. et al. The Mycobacterium tuberculosis protein O-phosphorylation landscape. (2024).
A.baumannii:
Massier, S. et al. Phosphorylation of Extracellular Proteins in Acinetobacter baumannii in Sessile Mode of Growth. Front. Microbiol. 12, 738780 (2021).
P.aeruginosa:
Ouidir, T., Jarnier, F., Cosette, P., Jouenne, T. & Hardouin, J. Extracellular Ser/Thr/Tyr phosphorylated proteins of Pseudomonas aeruginosa PA14 strain. PROTEOMICS 14, 2017–2030 (2014).
Ravichandran, A., Sugiyama, N., Tomita, M., Swarup, S. & Ishihama, Y. Ser/Thr/Tyr phosphoproteome analysis of pathogenic and non‐pathogenic Pseudomonas species. PROTEOMICS 9, 2764–2775 (2009).
M.tuberculosis
Xie, L. et al. Proteome-wide lysine acetylation profiling of the human pathogen Mycobacterium tuberculosis. Int. J. Biochem. Cell Biol. 59, 193–202 (2015).
M.abscesus
Guo, J. et al. Identification of Lysine Acetylation in Mycobacterium abscessus Using LC–MS/MS after Immunoprecipitation. J. Proteome Res. 15, 2567–2578 (2016).
A.baumannii
Massier, S. et al. Phosphorylation of Extracellular Proteins in Acinetobacter baumannii in Sessile Mode of Growth. Front. Microbiol. 12, 738780 (2021).
P.aeruginosa
Gaviard, C. et al. Lysine Succinylation and Acetylation in Pseudomonas aeruginosa. J. Proteome Res. 17, 2449–2459 (2018).
If you used the results of MutAnalyzer, please cite
Hopf, T. A. et al. The EVcouplings Python framework for coevolutionary sequence analysis. Bioinformatics 35, 1582–1584 (2019).
3.Who can use
Any user is free to access and use CliPME for non-commercial academic or industrial purposes without registration and charge.
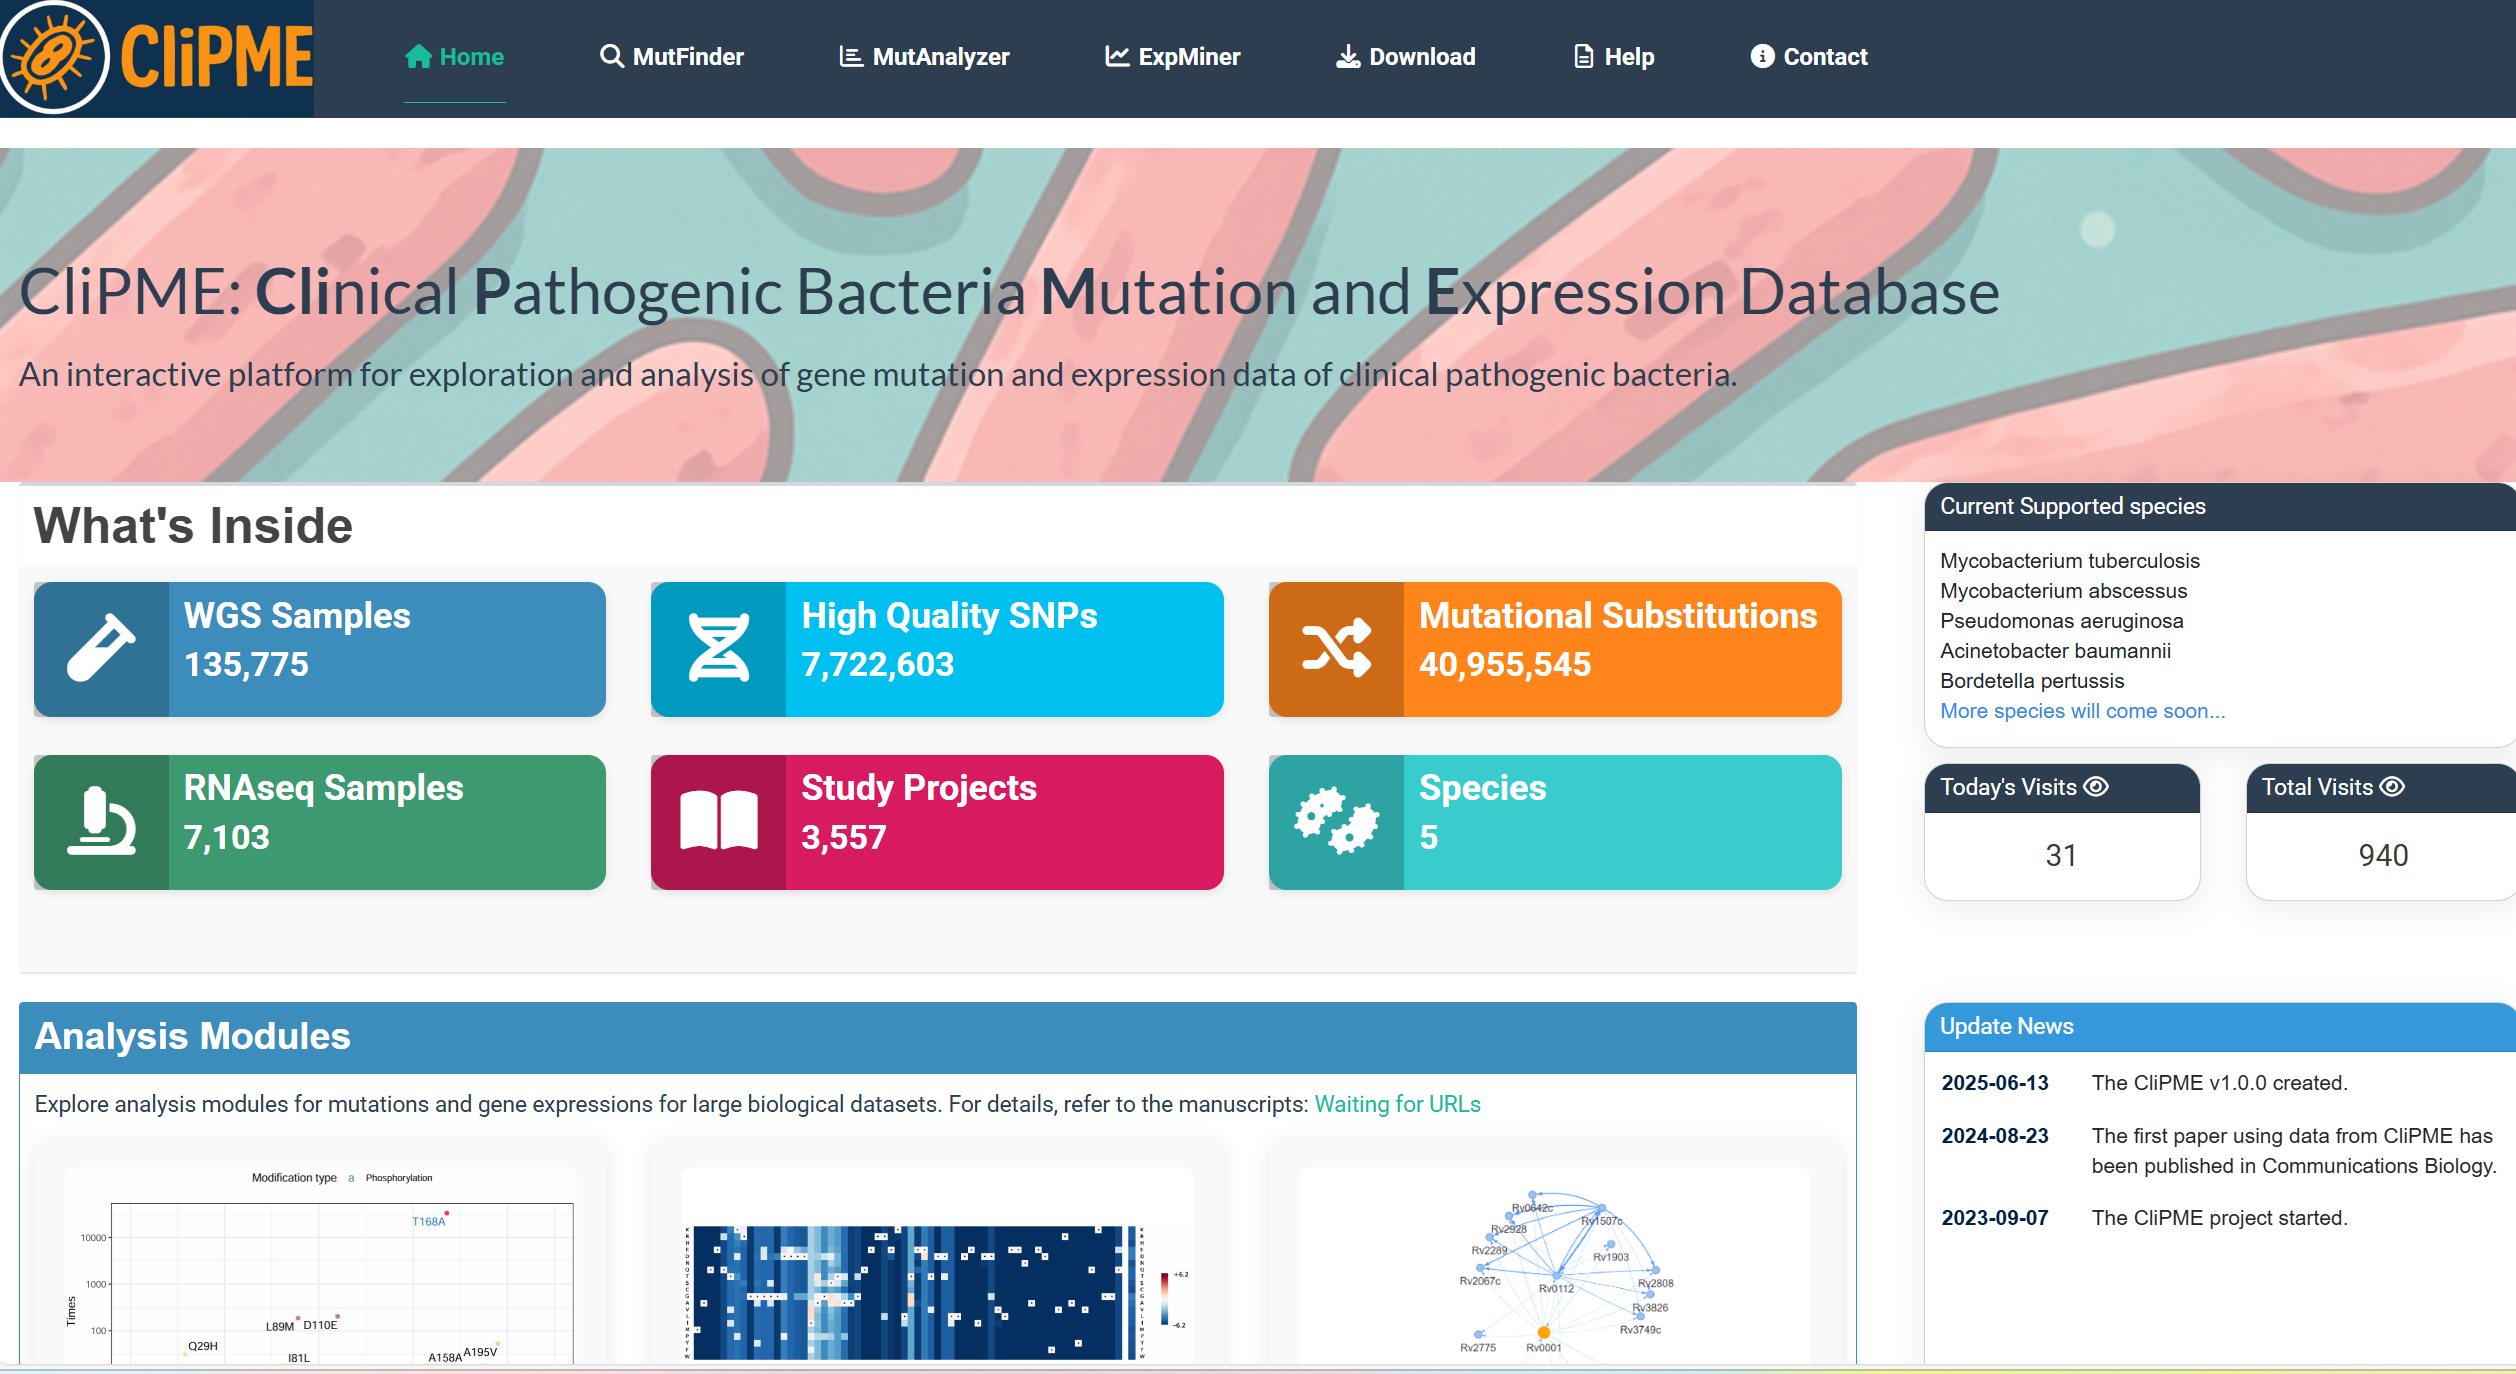
4.Home page
Home page provides a comprehensive overview of the website, contains number of WGS and RNAseq high quality sample, current supported species, analysis modules and update news.
Core Functional Modules:
-MutFinder:
Rapidly identify and visualize Mutations of clinical pathogenic bacteria.
-MutAnalyzer:
Analysis of mutation effect and possible evolutionary couplings.
-ExpMiner:
Perform gene expression analysis for target genes.
5.MutFinder page
Example workflow for rpoB gene analysis (Mycobacterium tuberculosis):
①Input parameters:
Enter the gene name (rpoB) or gene ID (Rv0667) in the
[Input Gene]
field, and select the species (Mycobacterium tuberculosis) from the
[Select Species]
dropdown.
Adjust visualization options:
Label density and Synonymous mutation display.
Click
[Submit]
to generate the mutation frequency plot.
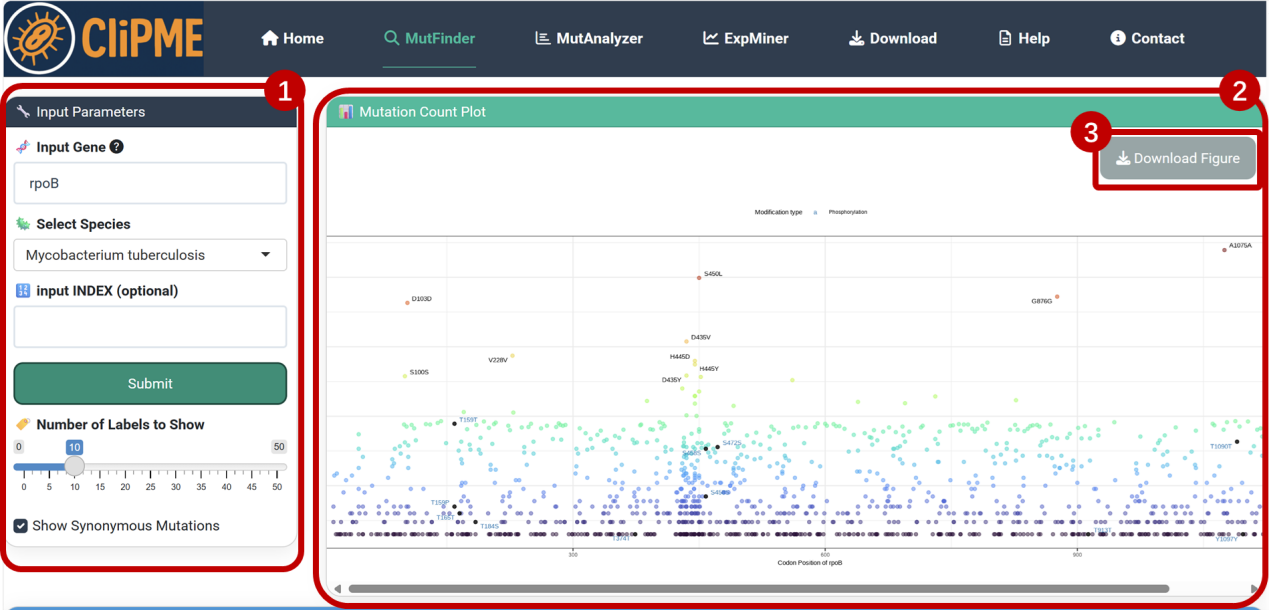
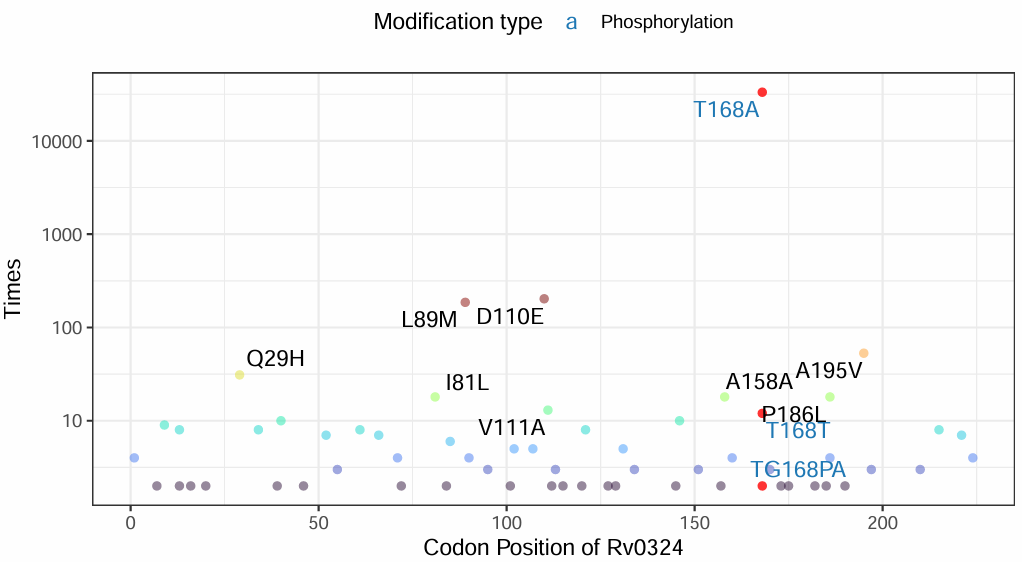
②Output visualization:
A frequency plot of clinical mutations in rpoB is displayed on the right panel.
③Click [Download Figure] to save the image.
④Mutation table:
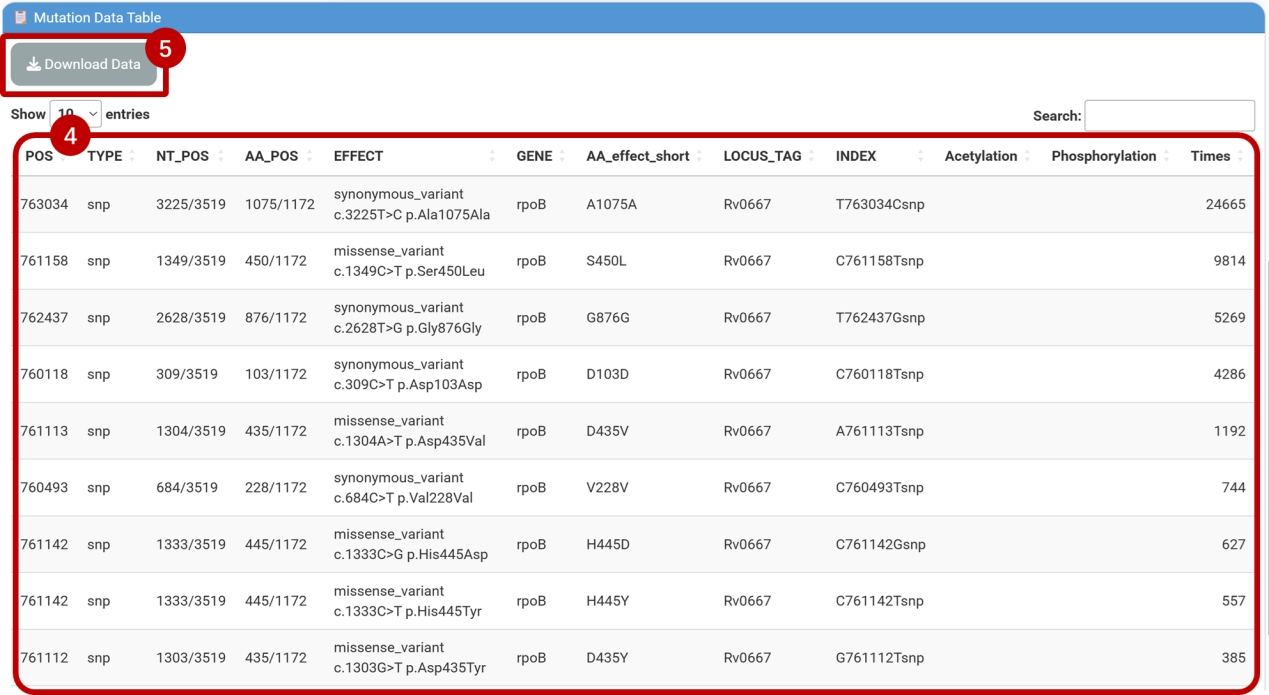
Scroll down to view detailed mutation data, including:
-POS: Genomic position of mutation
-TYPE: Mutation type
-NT_POS: Nucleotide sequence position of mutated base
-AA_POS: Amino acid sequence position of mutated residue
-EFFECT: Mutation effect(synonymous/missense, nucleotide position, base substitution pattern, amino acid change)
-GENE: Gene name
-AA_effect_short: Amino acid alteration
-LOCUS_TAG: Gene identifier
-INDEX: Variant identifier (format: Original base + Genomic position + Mutated base + Mutation type)
-Acetylation: Acetylation modification status
-Phosphorylation: Phosphorylation modification status
-Times: Mutation frequency
⑤Click [Download Data] to export the table.
⑥Adaptive mutation detection
Eg. Identify compensatory mutations in nusG under rifampicin resistance (caused by rpoB S450L mutation, INDEX: C761158Tsnp).
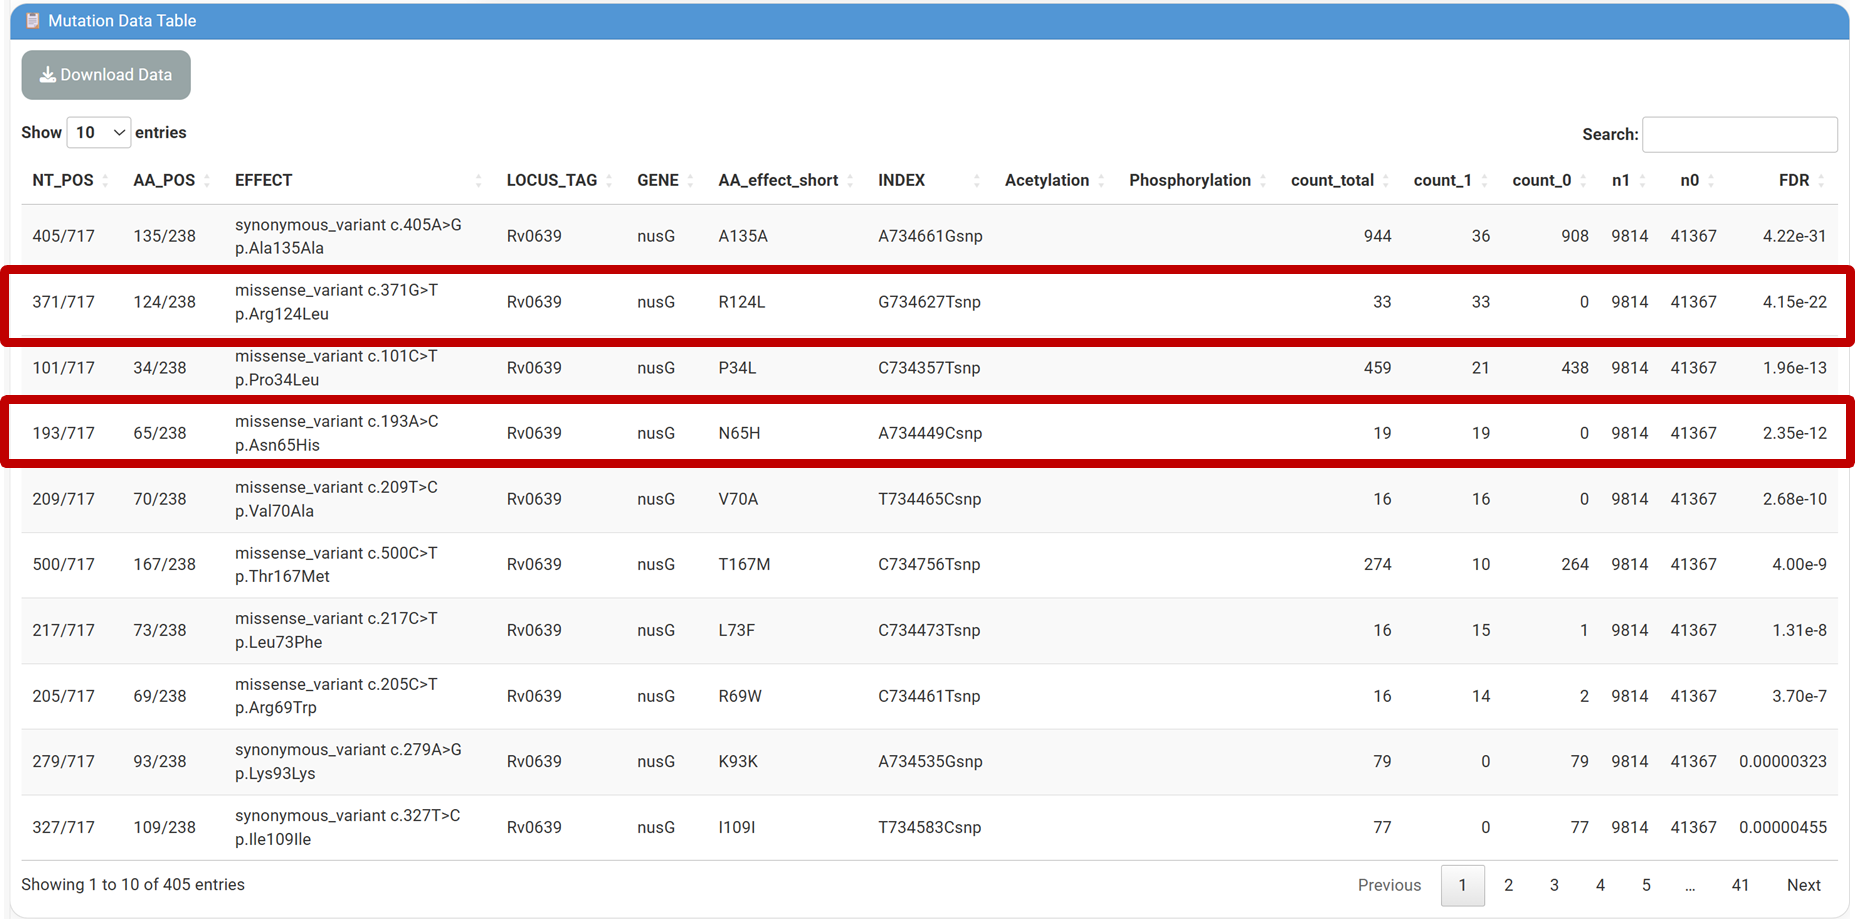
⑦⑧Enter nusG in [Input Gene] and paste INDEX(C761158Tsnp) into the [Input INDEX] field, Click [Submit] and navigate to the [Mutation Data Table] to view filtered results:
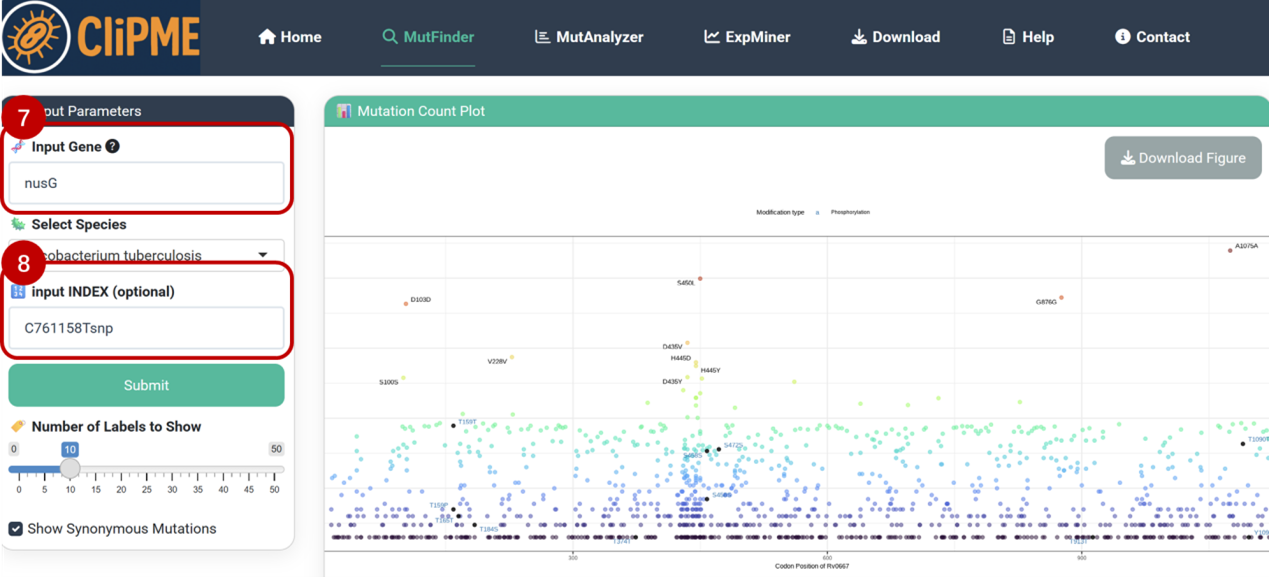
Result: The R124L and N65H mutations in nusG are significantly overrepresented in rpoB S450L strains (FDR = 4.15E-22), and has already been proved with improved fitness in RIF-resistant Mtb in a previous study published in Nature (2024) . Click the link in [AA_effect_short] column in the table to visualize the result for each mutation.
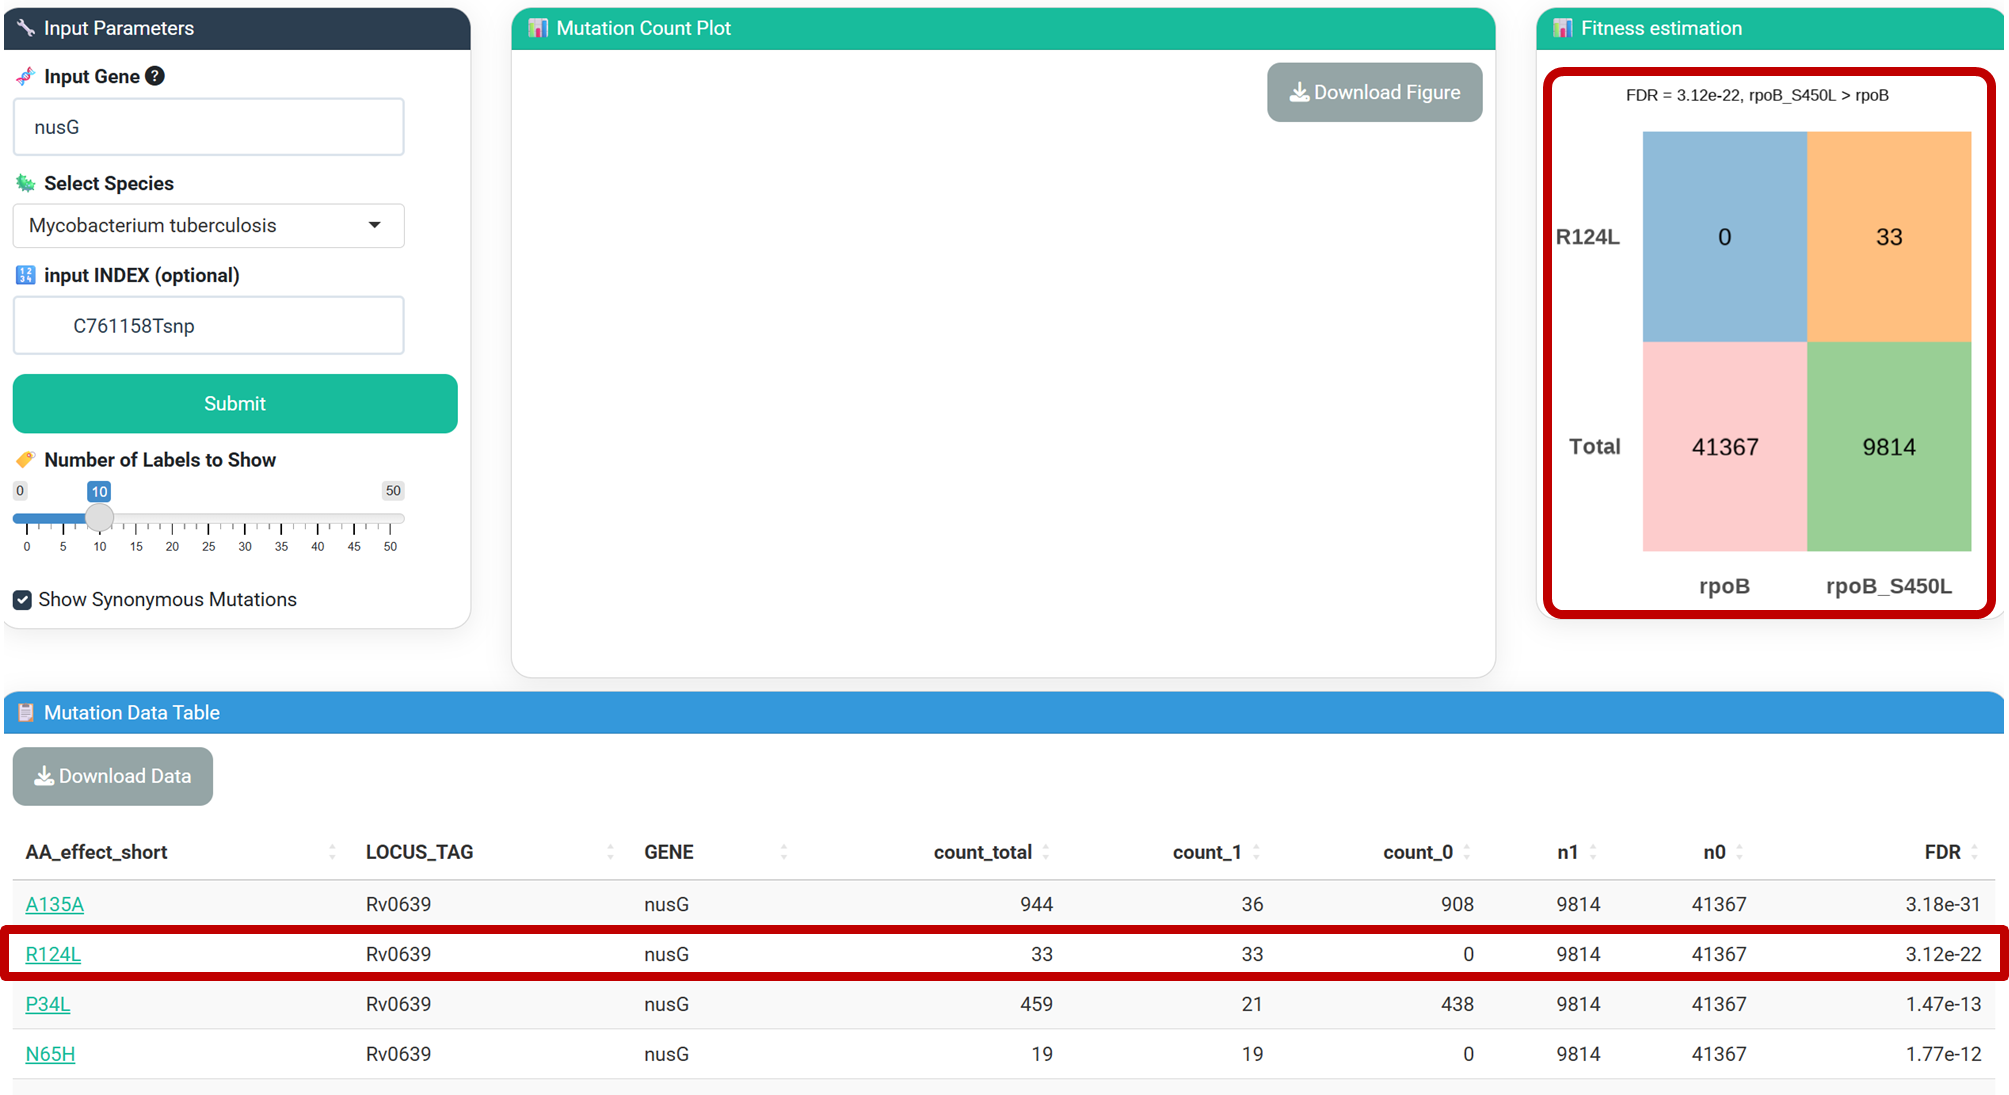
-count_total: Total occurrence of the mutation.
-count_1: Occurrence in strains with rpoB S450L.
-count_0: Occurrence in strains without rpoB S450L.
-n1/n0: Total strains with/without rpoB S450L.
6.MutAnalyzer page
Example workflow for katG gene analysis:
①Input configuration:
Enter the gene name (katG) or gene locus in the [Input Gene] field, and select species and analysis model (refer to EVcouplings literature for model differences), click [Analyze] to initiate computation.
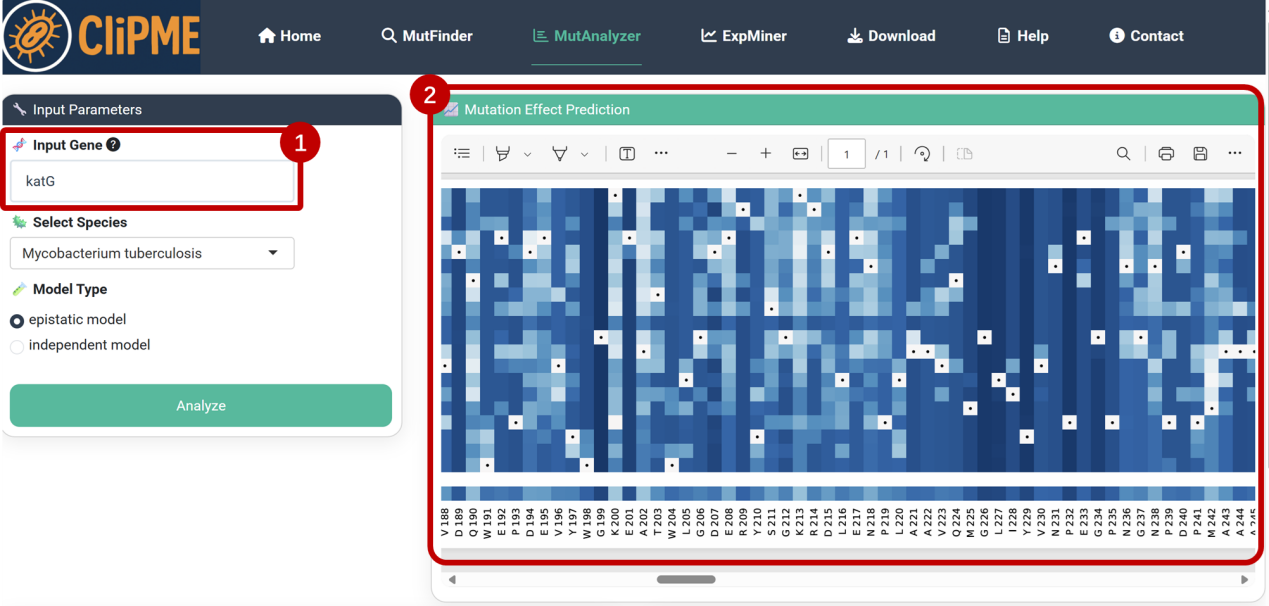
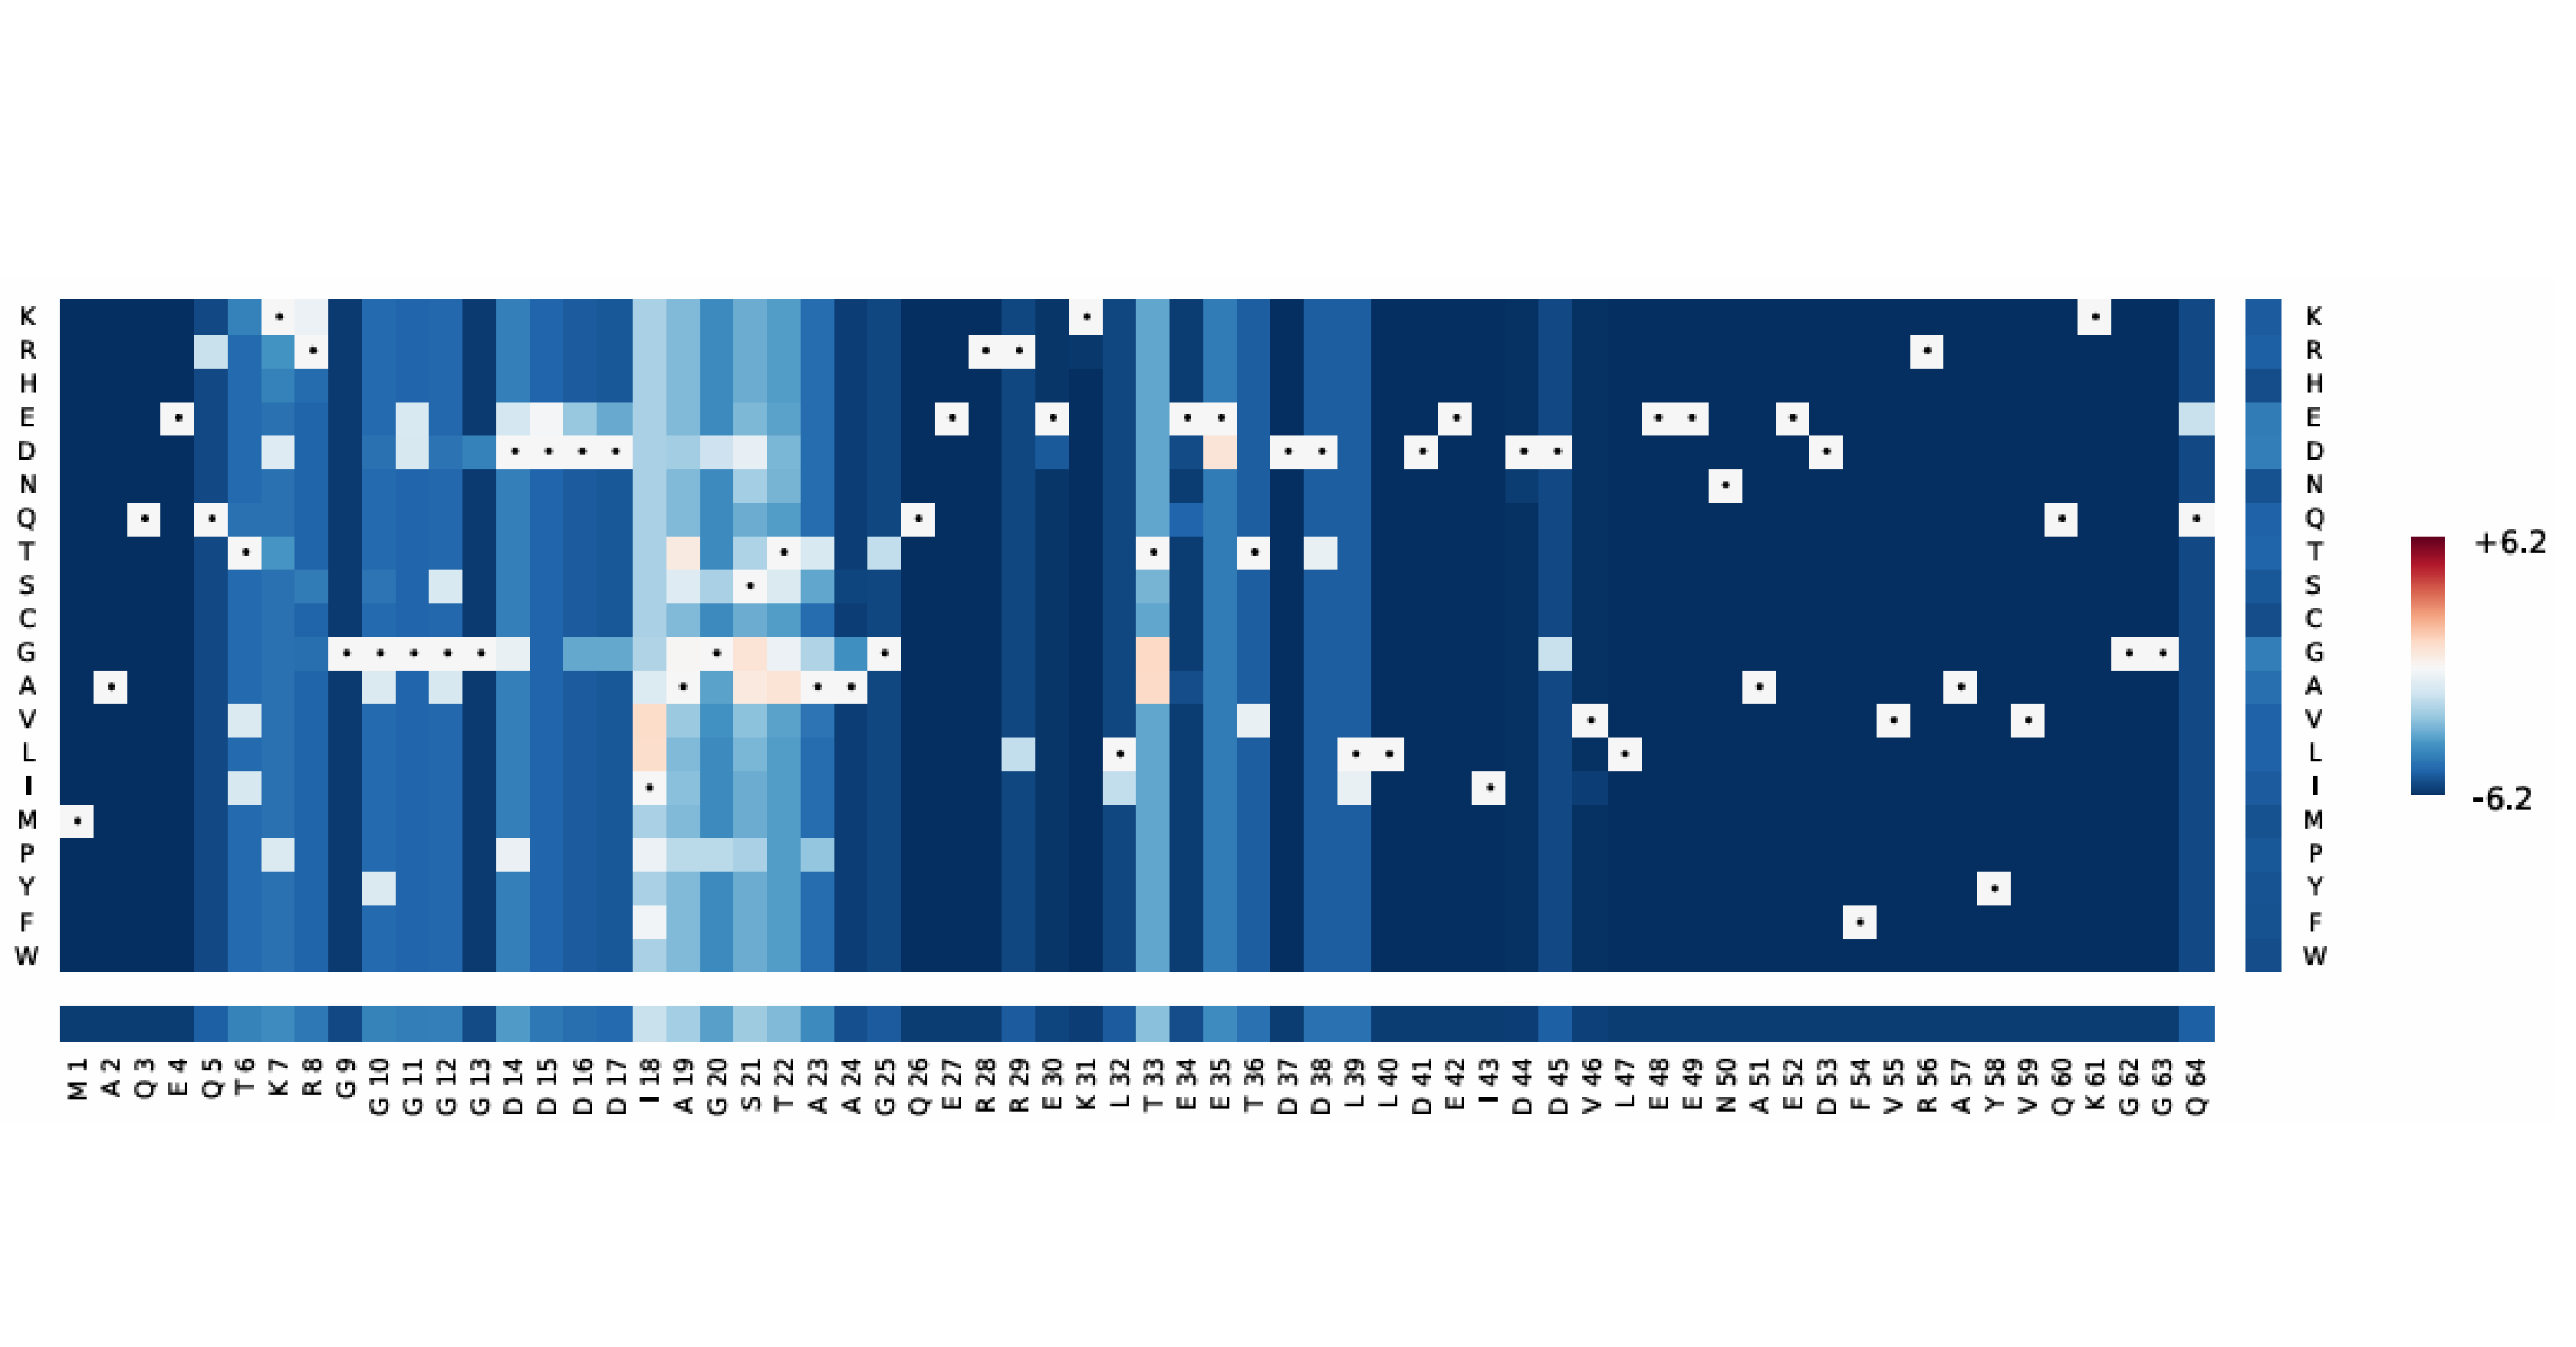
②Mutation effect prediction:
[Mutation Effect Prediction] panel displays potential functional impacts of single-site mutations.
③Evolutionary coupling visualization:
[Evolutionary Coupling Visualization] highlights co-evolving residues with structural/functional relevance.
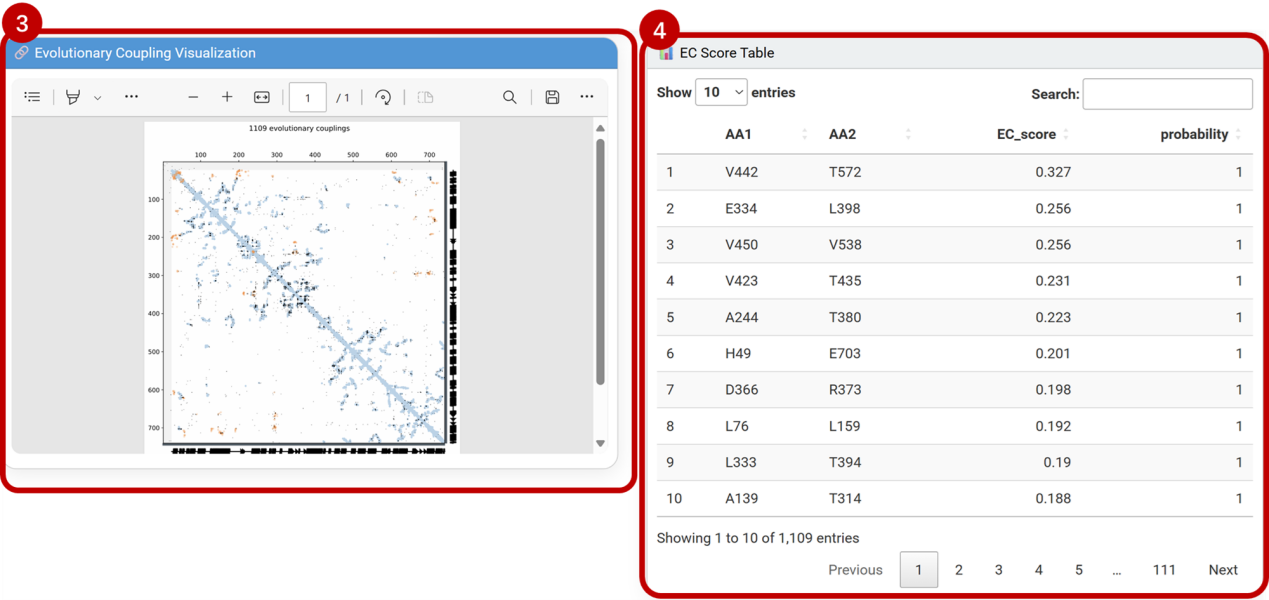
④Evolutionary coupling scores:
[EC Score Table] lists quantitative metrics: coupling probability, evolutionary conservation, and physicochemical constraint indices.
7.ExpMiner page
Example workflow for katG gene analysis:
①Input configuration:
Enter the gene name (katG) or gene ID in the [Input Gene] field, and select the species from the dropdown menu.Click [Submit] to initiate the analysis.
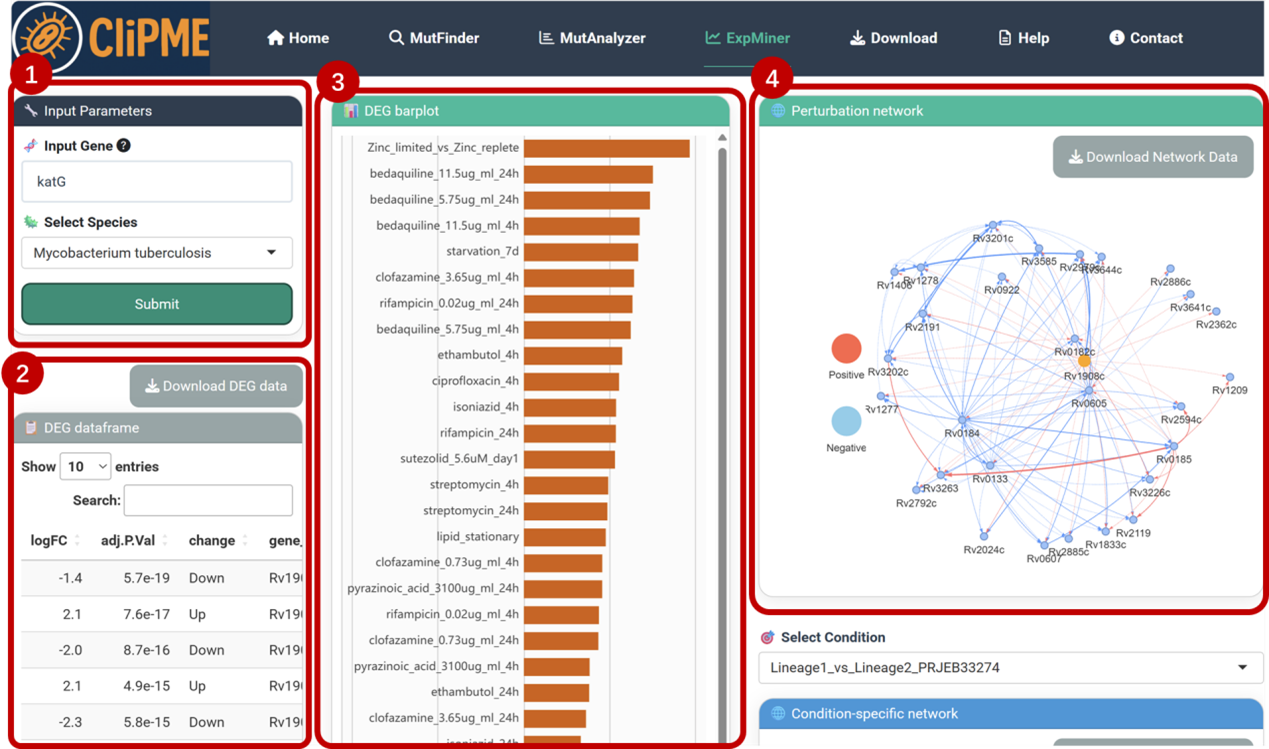
②DEG dataframe:
Displays expression changes of katG across experimental conditions (both statistically significant and non-significant differences).Click [Download DEG Data] to export the complete dataset.
③DEG barplot:
Visualizes only significant differential expression (FDR < 0.05 and |Log2FC| > 1).
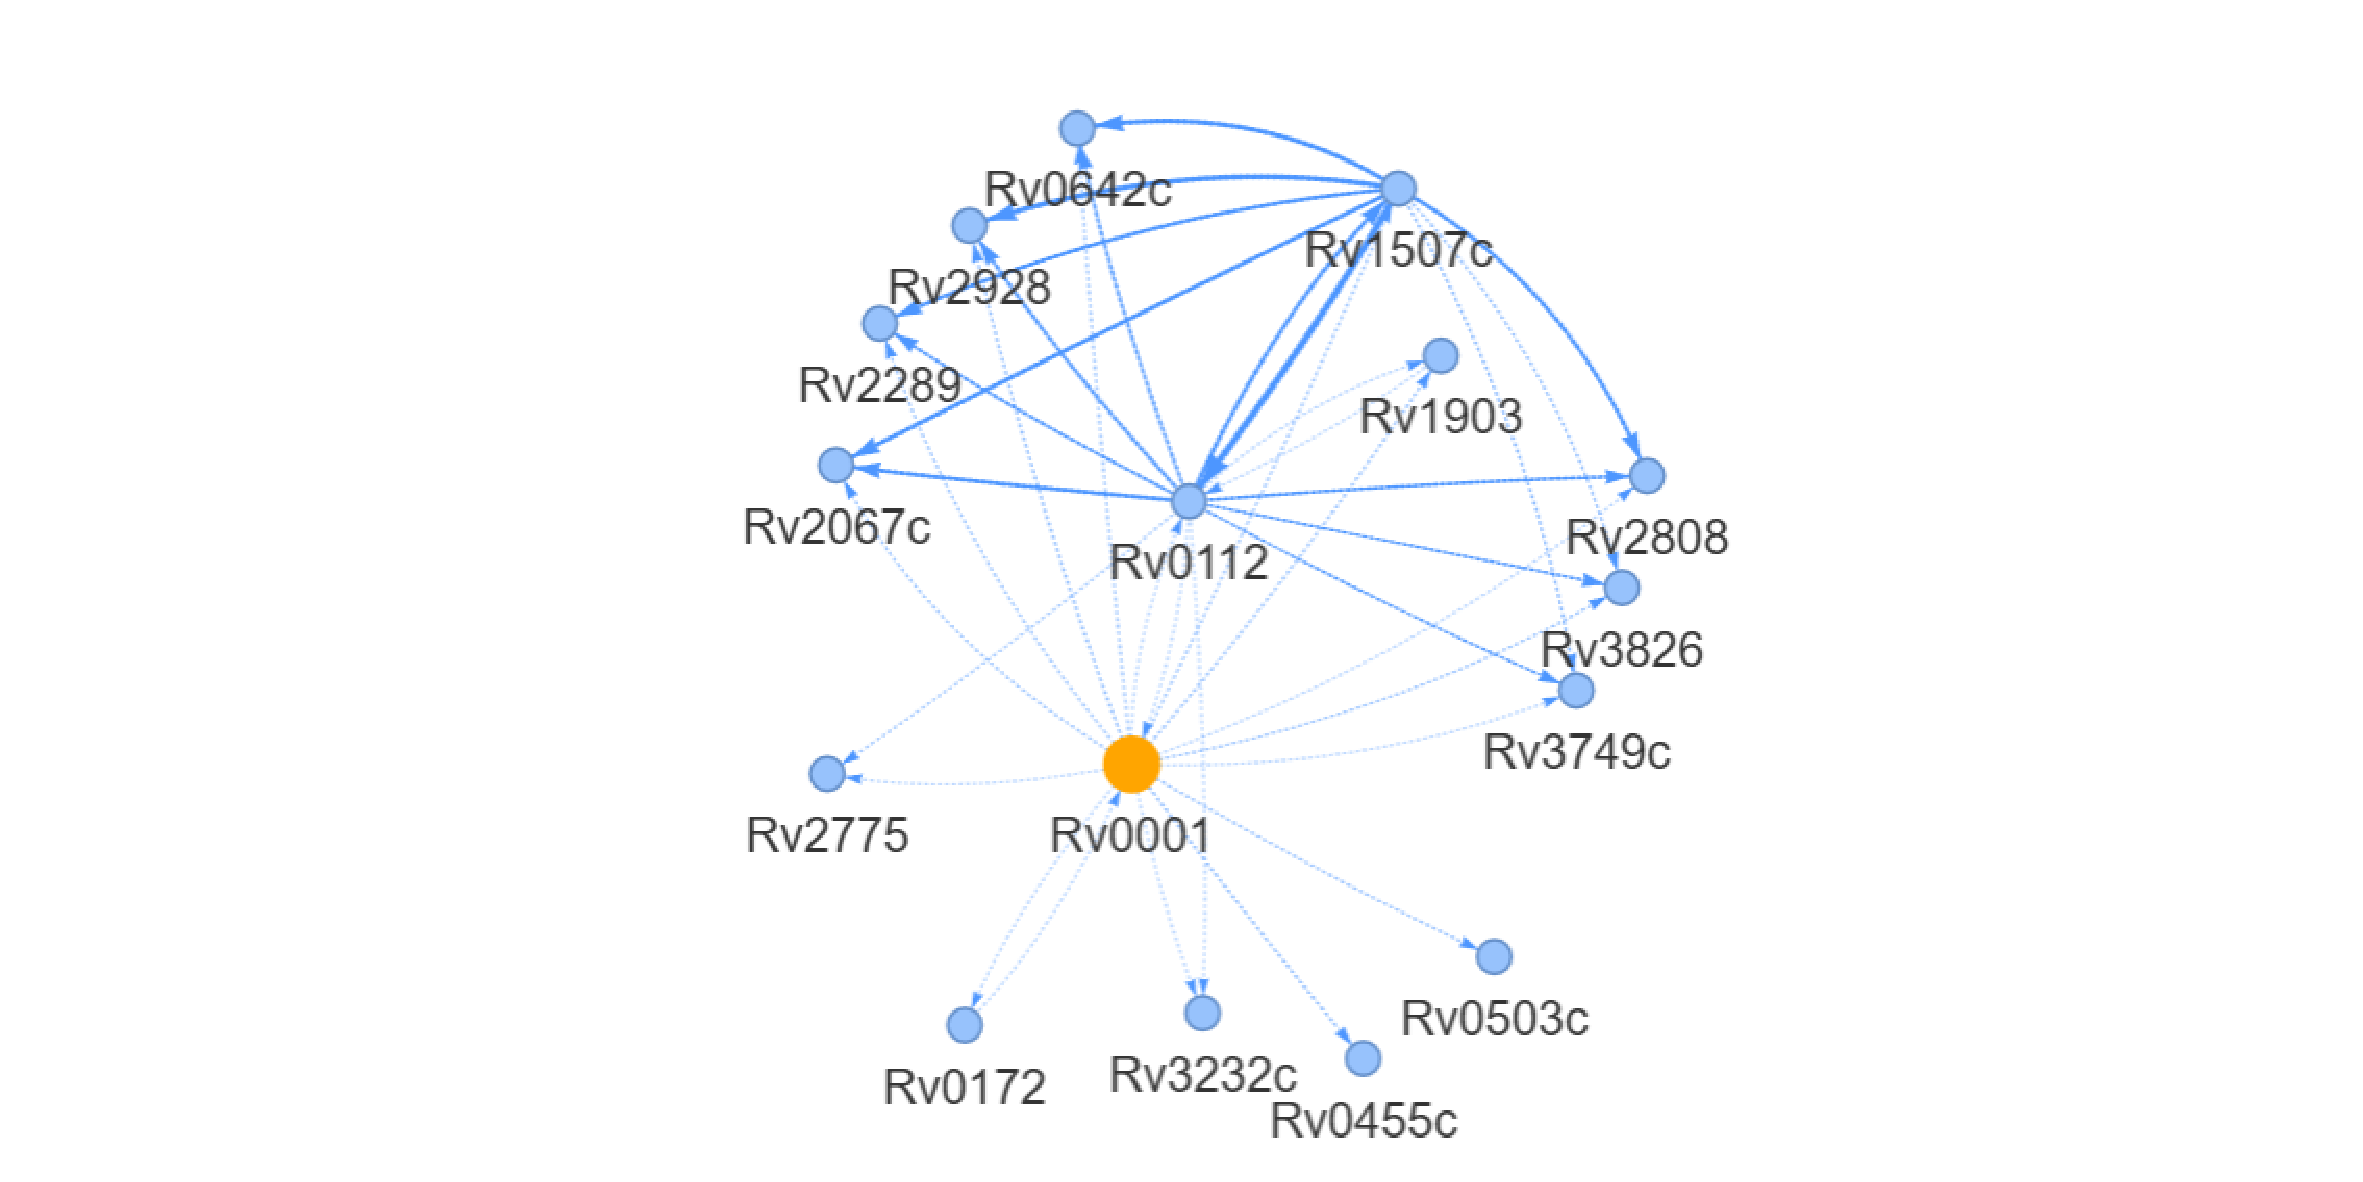
④Perturbation network Analysis:
Constructs a species-wide directed gene regulatory network using Bayesian network-based causal structure learning. Displays downstream genes affected by katG expression perturbations. Click [Download Network Data] to export edge lists and interaction scores.
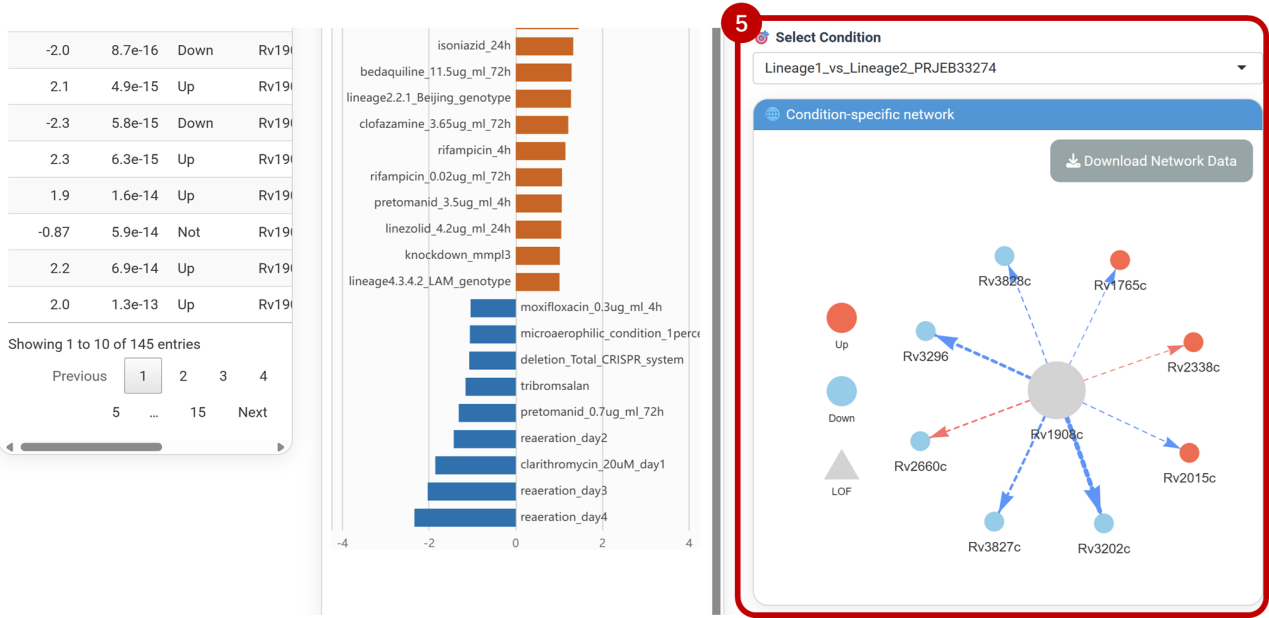
⑤Select Condition
Selecting experimental conditions via dropdown menus to analyzes context-specific interactions between differential genes and katG. Integrates mutation and transcriptomic data to annotate unfixed loss-of-function mutations (▲) within the network, revealing their context-dependent functional roles. Click [Download Network Data] to export interaction pairs and mutation annotations.
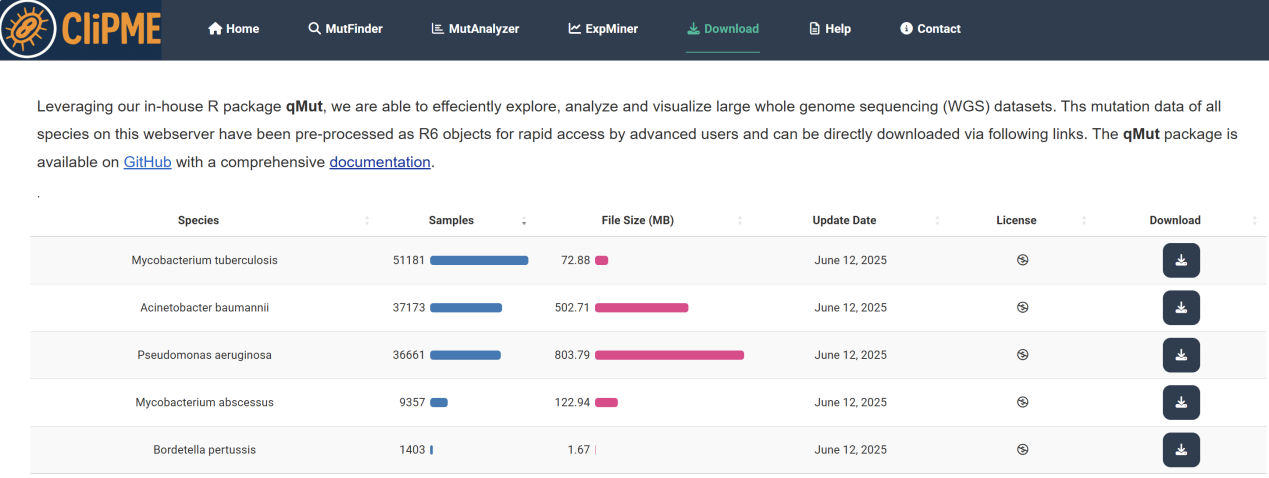
8.Download page
Provides access to the GitHub download link for the qMut R package source and its usage instructions. Click the [GitHub] hyperlink to install the software, and use the [documentation] hyperlink to view the complete qMut tutorial in our [Download ] page.